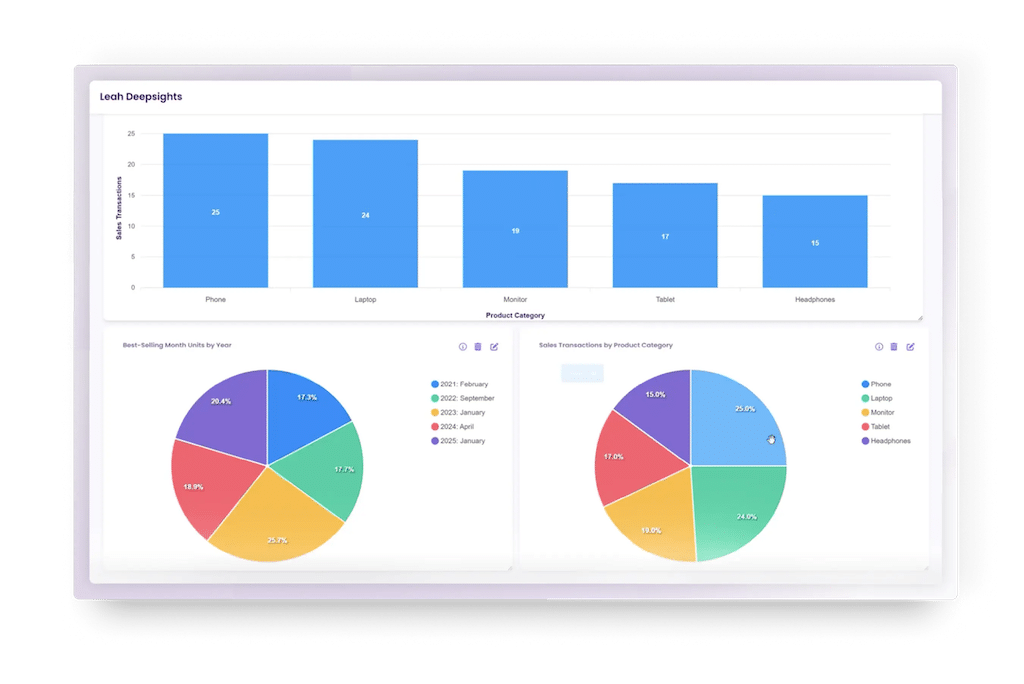
Deepsights: Board, Suite
Financial health insights
×

Deepsights: Board, Suite
A pre-built dashboard that gives both the C-Suite and Board additional visibility into the overall financial health of the organization, based on contract data.
Deepsights: Chief Procurement Officer
Procurement analytics
×
Deepsights: Chief Procurement Officer
A consolidated actionable view into your company’s obligations, spending, and risk. The dashboard highlights top suppliers and overall trends in spending and savings.
Deepsights: Chief Revenue Officer
Sales pipeline insights
×
Deepsights: Chief Revenue Officer
The CRO dashboard delivers sales leaders deeper insight into the pipeline, elevating late-stage deals in contract negotiations, alongside upcoming renewals and expirations.
Deepsights: GRC
Real-time contract health
×
Deepsights: GRC
This AI-powered dashboard elevates data for legal leaders in real-time, giving legal teams instant insight into the overall health of their contracts and contract data.
Multi-File Deep Analysis
Comprehensive multi document analysis
×
Multi-File Deep Analysis
Perform in-depth analysis across multiple documents, identifying key insights, gaps, and relationships to support large-scale legal projects efficiently and accurately.
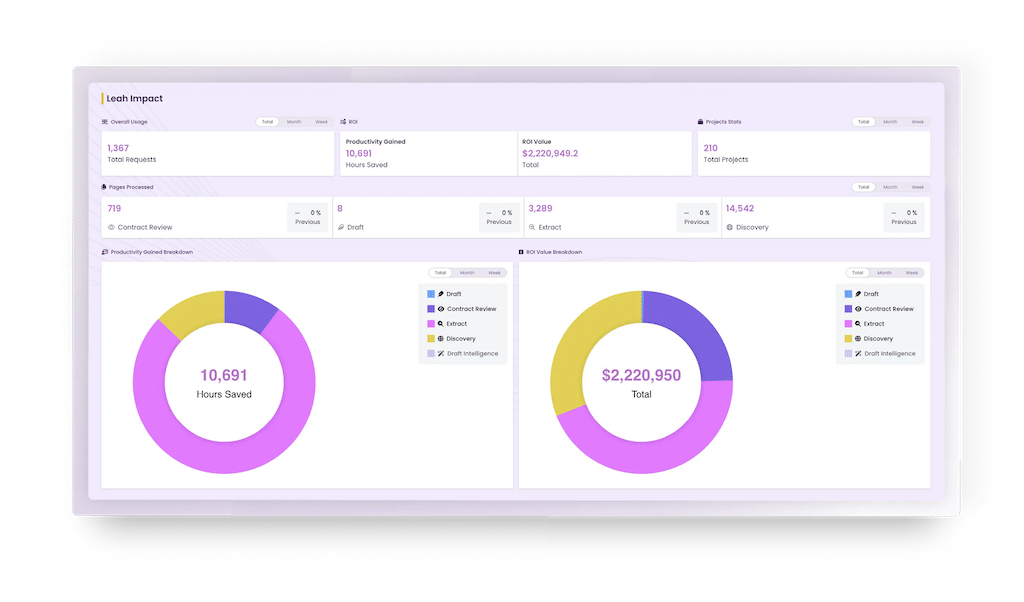
Legal Ops Insights
Elevate operational data
×
Legal Ops Insights
Elevate key operational data for legal leaders and their teams to make more informed decisions.
Legal Intake Insights
Real-time request insights
×
Legal Intake Insights
Centralized, real-time insight into the volume, type, and status of all your legal requests.